EASy MAP Protocol
Acquire the focused exam → identify the hemodynamic phenotype → act on a resuscitation decision.
A systematic approach to evaluating the hypotensive patient using point-of-care ultrasound
What is EASy MAP?
EASy MAP stands for Echocardiographic Assessment using Subxiphoid-only view — Mean Arterial Pressure.
It is a concise point-of-care ultrasound examination designed for immediate determination of cardiovascular and cardiorespiratory status in patients with hypotension (MAP < 65 mmHg). The full method — all six views, common pitfalls, and a 12-point cardiac image-quality scale — is published in the Journal of Visualized Experiments (2025).
Key Features
- Rapid acquisition -- Training goal: the six views in under 3 minutes, without compromising image adequacy
- Single probe -- Uses only a phased array transducer
- Pattern recognition -- Identify hemodynamic phenotypes quickly
- Beginner-friendly -- Images sufficient for supervised decision-making in 87% of novice exams
Patient Inclusion Criteria
Inclusion:
Mean Arterial Pressure (MAP) < 65 mmHg
Exclusions:
- Cardiac arrest with active compressions — use EASy ALS
- Unable to tolerate the supine position
Limitation:
Inadequate image quality despite optimization — from body habitus, subcutaneous air, dressings, or bowel gas — limits the exam. Try an alternative window, or escalate to transesophageal or consultative echocardiography.
Acquire & interpret the EASy exam
Watch the full acquisition of all six views, then how to read, report, and apply the findings at the bedside during rounds.
All six views in sequence — subcostal cardiac & IVC, anterior upper lung, and posterolateral pleural.
Free acquisition card for each viewReading the findings and reporting the EASy exam.
Uses the EASy laminated cardsApplying the EASy exam in clinical context — interpreting findings at the bedside during rounds.
Uses the EASy MAP toolPutting it together
EASy is one integrated sweep, not six isolated views. Anchored at the subcostal window, you read heart, IVC, lung, and pleura together to name the predominant physiology — then classify it and carry it into the clinical decision. The three clips above walk this through end to end.
Acquire at the bedside
One subcostal-anchored sweep — subcostal cardiac and IVC, then anterior upper lung and posterolateral pleura — captures all six views with a single phased-array probe. The course target is all six adequate views in under three minutes.
Classify & report
Lay the combined findings on the EASy phenotype card: the cardiac pattern sets the cluster, the IVC and lung refine it, and you land on one phenotype — a shared label you can hand off in a sentence.
Integrate on rounds
Bring that phenotype into the clinical picture — history, monitor, trajectory — to drive the decision, then repeat the sweep to reassess as the predominant physiology shifts.
What each window adds to the picture
The pump. LV and RV size and function set the cluster and point to the predominant lesion.
Venous filling and right-sided pressure context — flat, normal, or plethoric. Read with the heart and lung, not alone: the IVC does not by itself establish volume status, fluid responsiveness, or fluid tolerance.
A-lines vs B-lines — pulmonary aeration and interstitial syndrome. Distribution, clinical context, and the cardiac findings determine how this should weigh on a fluid decision; B-lines are not specific to cardiogenic congestion.
Effusion, consolidation, or absent sliding — the obstructive and structural contributors (hemothorax, a tamponade compounder, pneumothorax).
Read together, the four windows name the predominant physiology behind BP = CO × SVR — the one driver to treat first, then reassess.
Hemodynamic Phenotypes
Pattern recognition for rapid diagnosis and management
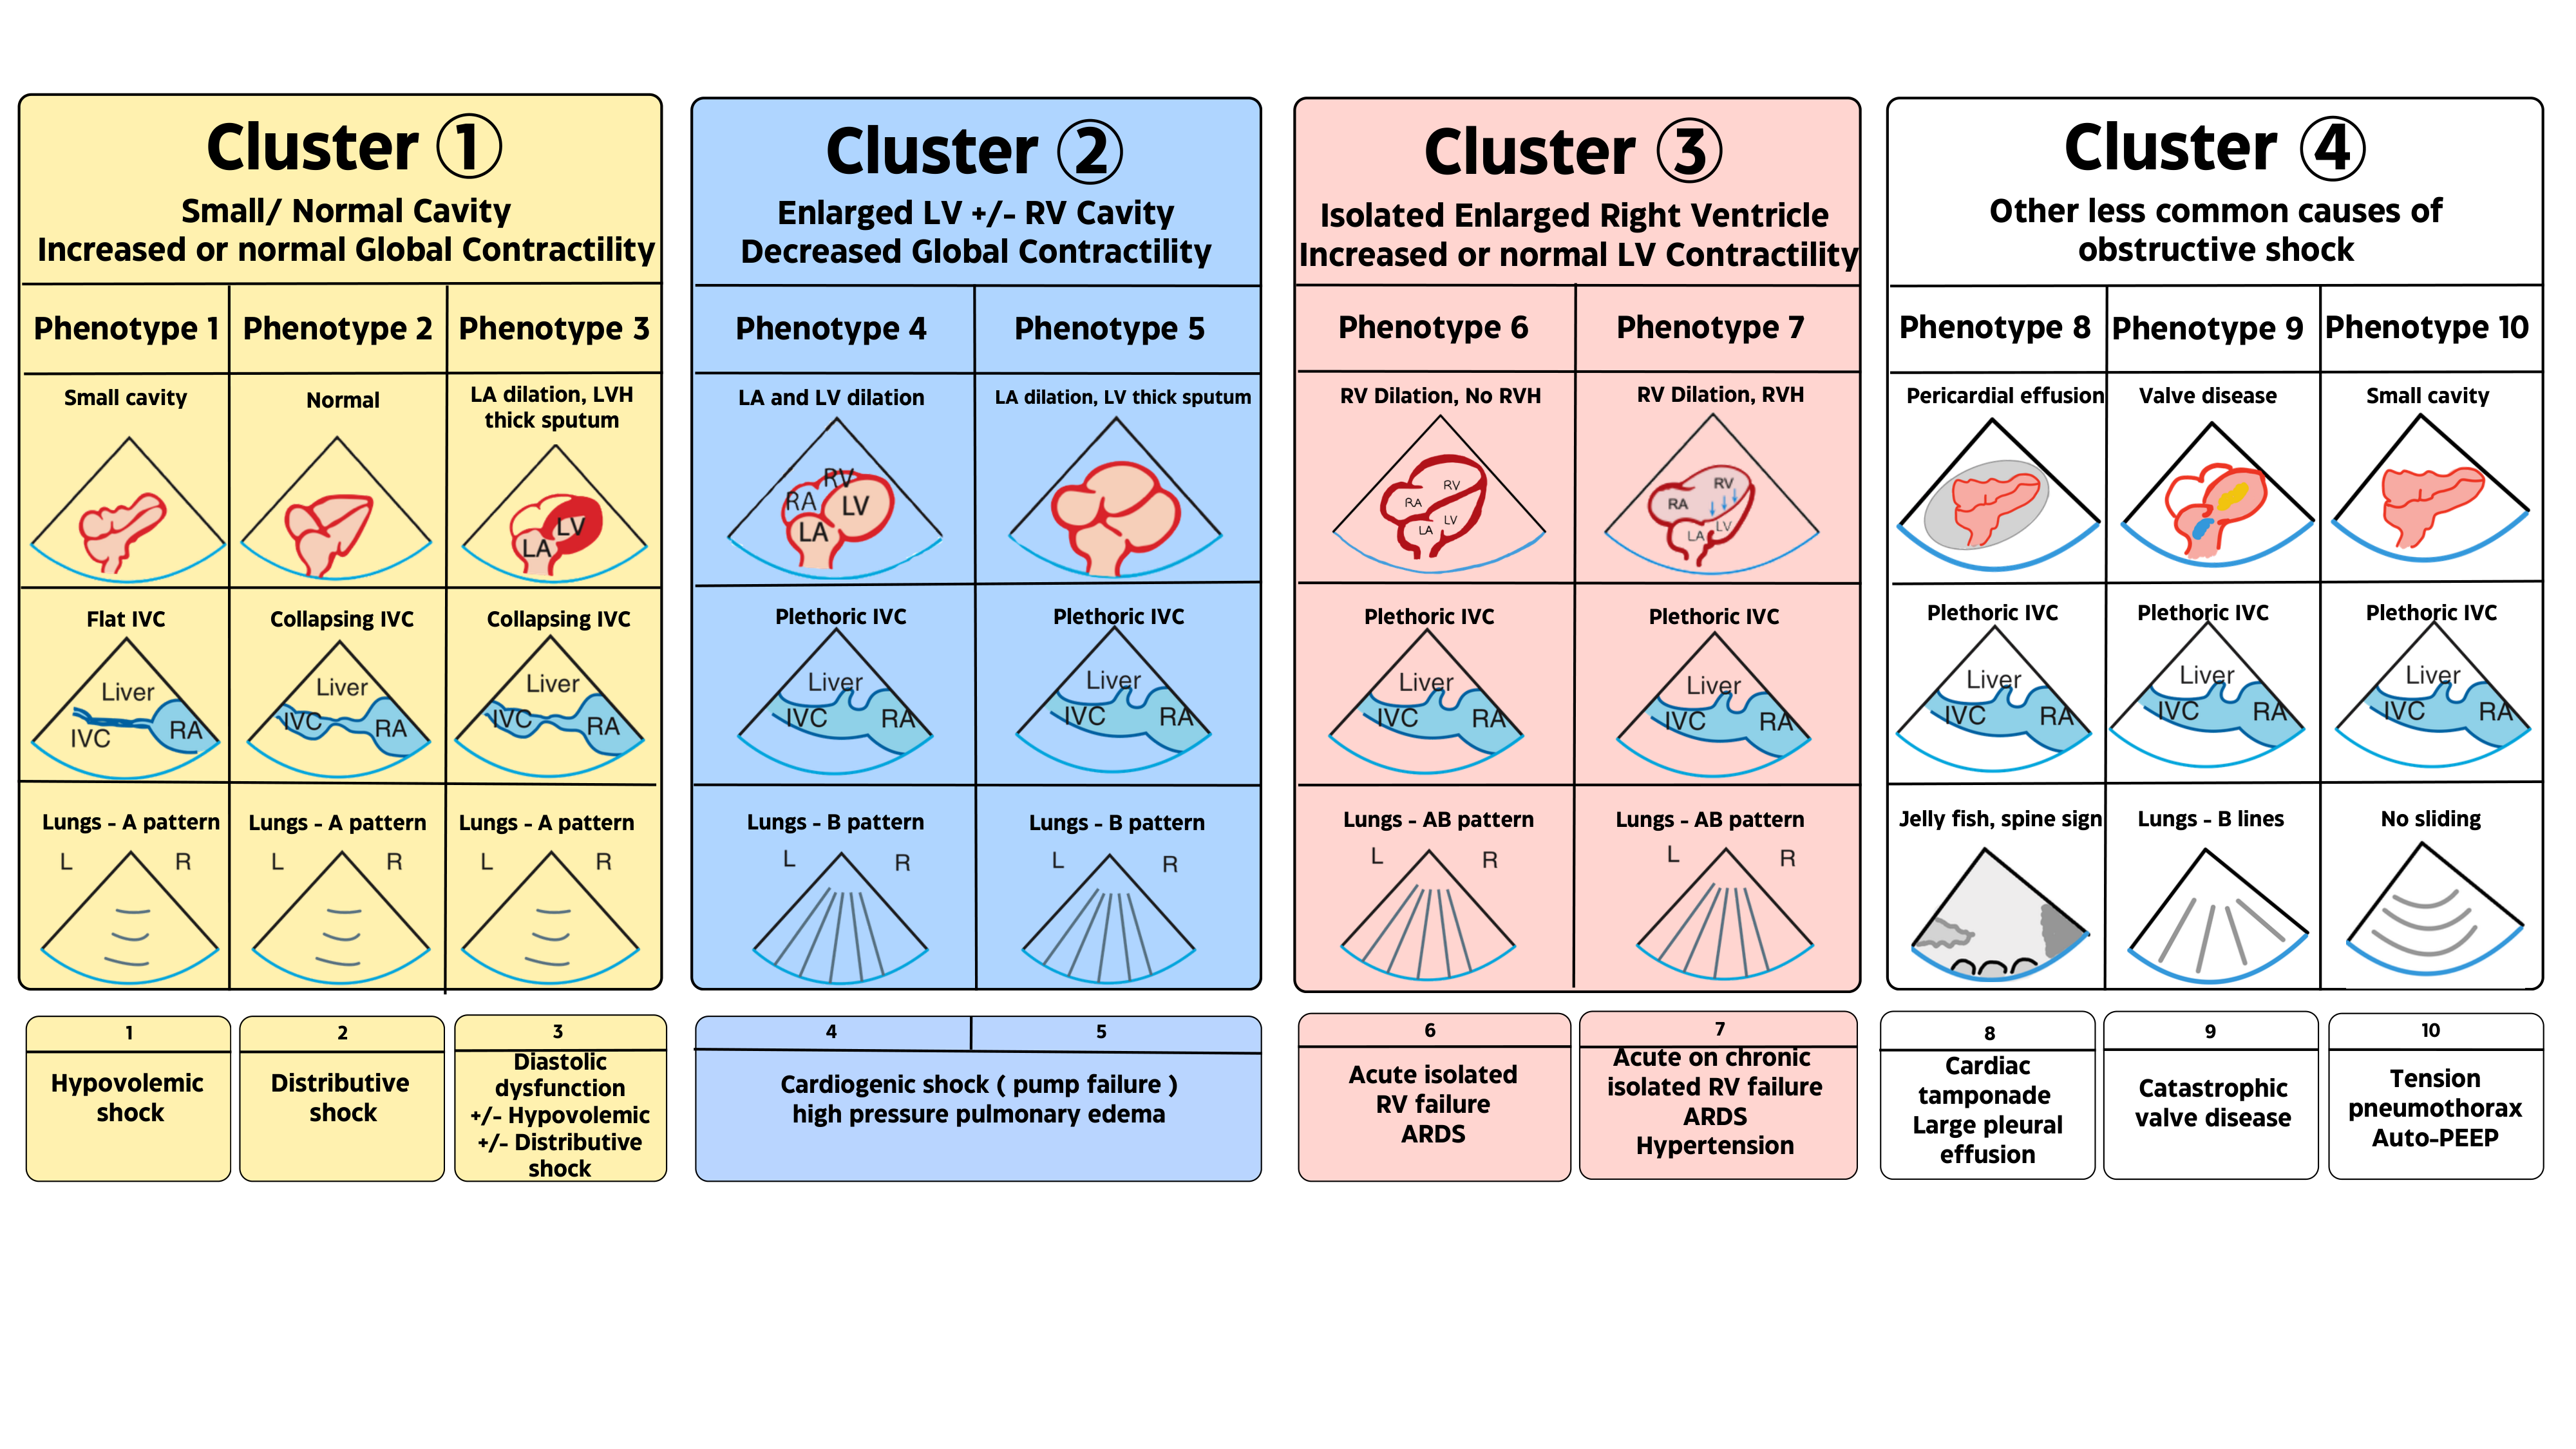
All 10, one at a time — cardiac · IVC · lung
Pick the dominant cardiac finding
Both ventricles working well — normal or increased contractility
What you see
Heart: Small cavity, increased contractility
IVC: Flat
Lungs: A pattern (dry) fluid-tolerant
What it means
Hypovolemic shock — findings support marked underfilling.
Management considerations
Give fluid, and find the source of the loss.
Work a live patient through the phenotypes
The interactive EASy MAP tool takes your heart, IVC, lung, and pleural findings and returns the phenotype with its etiology, the physiology-informed considerations that follow from it, and the BP = CO × SVR rule-out worksheet — plus the 12-point cardiac image-quality score.
Open the interactive EASy MAP toolPublished methods
EASy MAP is a peer-reviewed, video-illustrated protocol. The methods paper demonstrates acquisition of all six views with a low-frequency phased-array transducer — subcostal cardiac and IVC for the cardiovascular assessment, supplemented by anterior upper-lung and posterolateral diaphragmatic pleural views for the respiratory assessment — along with common pitfalls and a 12-point scale for rating cardiac image quality.
Howell-Clark JR, Bronshteyn YS, Pustavoitau A, Convissar D, Bughrara N. Echocardiographic Assessment Using Subxiphoid-Only Examination for Hypotensive Patients. J Vis Exp. 2025;(218):e67531.Protocol Resources
Downloadable guides, checklists, and reference cards
Ready to learn EASy MAP?
Enroll in the fundamentals course or download the reference materials.
Every EASy application is one loop of the same pathway. See the next step in the pathway